Wastewater Collection System
Combined sewer systems were introduced in the mid 1800’s to collect and transport stormwater runoff and sewage in the same pipe. Back then stormwater and sewage were discharged directly to the nearest river, stream, or other water body. Since the 1960’s sewage and stormwater systems are built as separate systems to handle sewage and stormwater in separate pipes. However, much of the old combined sewer systems still remain.
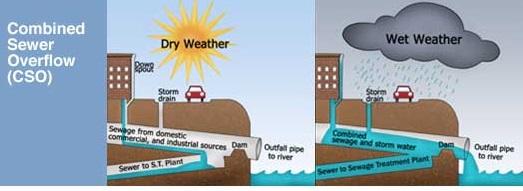
During dry weather, a combined sewer system transports all sewage to the wastewater treatment plant for treatment prior to discharge to a waterway. However, during wet weather, as you can imagine, there can be a tremendous amount of water from streets, parking lots, roof drains, sump pumps, foundation drains, etc., and, at times, can exceed the capacity of the combined sewer system pipes and the plant.
To prevent the excessive flow from backing up into basements, streets, parking lots, etc., combined sewer systems were built with overflow pipes. These overflow points are known as combined sewer overflows (CSO).
More for information about CSOs.

The EPA’s mandate on CSOs left communities with two basic options: install separate pipes for sewage and stormwater or keep the combined pipes and somehow build more capacity. Either way is extremely expensive. With very little state and federal funding, communities are expected to raise sewer rates to pay for the work. The typical state and federal funding assistance is a low interest
loan which the community pays back in full with interest.

Haverhill has approximately 200 miles of separate and combined sewer pipes. The separate sewer area covers approximately 6,800 acres and the combined area covers approximately 1,500 acres with 13 active CSO outfalls which discharge to the Merrimack River or the Little River.
Map of Haverhill’s CSOs.
During dry weather all sewage is conveyed to the wastewater
treatment plant for treatment prior to discharge to the Merrimack River. The treatment plant does not discharge untreated sewage at any time during dry weather or wet weather. Plant staff are proud of the high quality effluent from the plant.

streets, etc..
CSO Outfall Monitoring
Since February 2014, the City has continuously monitored each CSO outfall. The monitoring equipment notifies us when a CSO overflow is occurring and provides data to determine the overflow volume for each activation. The detailed overflow statistics are provided in our annual CSO reports which are available via the links listed below.
CSO volumes vary significantly with rainfall amounts, rainfall intensities, storm duration, groundwater levels, weather patterns, and many other factors. In addition to monitoring the CSO outfalls, we also monitor rainfall. Our annual CSO reports provide rainfall amounts, rainfall intensity, and the storm durations associated with each CSO overflow.
The table below shows the annual CSO volumes since 2015. Typically higher annual overflow volumes occur in years with more rain. In dry years, short term weather patterns can have a significant impact on CSO volumes. For example, in 2016 we had 8 inches of rain in the month of October, which is much higher than normal. Almost half of the CSO volume for 2016 occurred in October.
| Year | Annual Overflow Volume (Million Gallons) |
Rainfall (Inches) |
| 2023 | 97.3 | 58.5 |
| 2022 | 10.8 | 33.2 |
| 2021 | 48.1 | 56.6 |
| 2020 | 15.0 | 44.1 |
| 2019 | 43.6 | 50.5 |
| 2018 | 49.5 | 54.8 |
| 2017 | 30.8 | 48.1 |
| 2016 | 21.4 | 33.8 |
| 2015 | 8.1 | 36.6 |
Annual average rainfall is 43 inches.
To correct this situation, over the last 20 plus years, the City has undertaken a number of easy-to-install improvements as well as more costly improvements. The City also performs numerous day-to-day operation and maintenance activities to minimize CSOs.

Phase II CSO improvements were complete in early 2017. The computer model calculated that, for an average rainfall year, the Phase II improvements would reduce annual CSO volume to approximately 20 million gallons and eliminate or reduce the frequency of CSOs from a number of outfalls. The cost of the Phase II program was $12 million.
Phase III is in the beginning stages and is expected to cost $15 to $20 million.
CSO Annual Reports: 2003, 2004, 2006, 2007, 2008, 2009, 2010, 2011, 2012, 2013, 2014, 2015, 2016, 2017, 2018, 2019, 2020, 2021, 2022, 2023,2024
Infiltration Inflow Annual Reports: 2007, 2008, 2009, 2010, 2011, 2012, 2013, 2014, 2015, 2016, 2017, 2018
Contact Us
Haverhill City Hall
4 Summer Street
Haverhill MA, 01830
Monday - Friday 8:00 - 4:00
Call Center 311 (within city limits)
(978) 358-1311 (outside the city)
